
Yet another disastrous year for embattled commodity investors but the bull case is stronger than ever
2015 is not a year that investors in hard commodities will want to remember. In fact, as the table below shows, the commodities basket, as represented by the Thomson Reuters Core CRB index, was down for an unprecedented 5th year, with the pace of its decline accelerating, returning a negative 23.43% last year. Ouch!
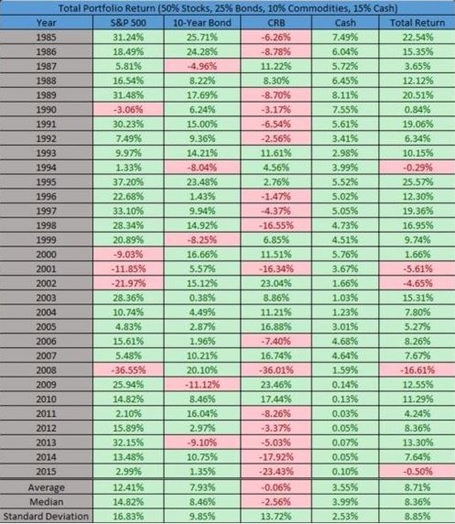
What stands out to us on the table however, is that over the 30 year historic period the commodities basket has actually returned negative figures on both simple and median calculation measures. The bare stats reveal a negative 0.06% and 2.56% per annum return respectively. Not only has this index produced poor returns to investors at a base level but it has done this even after incorporating the excess returns seen from the basket during the so called “commodities supercycle” from 2001 – 2008. Takeaway from these observations? Commodities are not buy and hold investments but are for trading.
Even worse, the standard deviation of these returns (a measure of volatility and variability) is almost as high as equities. Contrast that with the S&P500 returning a median 14.82% per annum over the same period. In short, investors have taken on more risk relative to all other asset classes bar equities and have not been rewarded over such a long timescale.
The cure for low prices is… low prices
You’ll be forgiven at this stage for questioning whether we had titled this piece inappropriately..! There is an age old saying in investments: “the cure for low prices is… low prices” and as the chart below illustrates very succinctly, the CRB basket is now plumbing depths not seen for over 17 years.
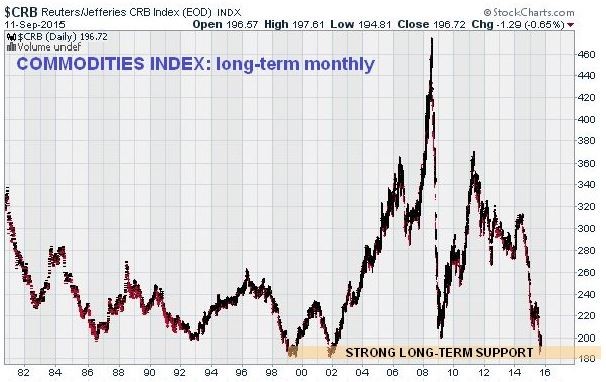
There is another takeaway from this 30 year dataset and the chart above though which is that, as with most markets, the returns from commodities are cyclical. And we can see from both the chart and the table that after a period of poor returns, where excesses are washed from the system, subsequent years’ returns are strong. In fact, the deeper the drawdown the stronger the rebound.
As we enter 2016 and the possibility of a continuation of the record breaking stats in the event of a YTD negative return being produced, investors can be in no doubt that sentiment is about as bleak as it comes.
Our conclusion, as you will see from the remainder of this piece, is that with many commodities now trading at less than the marginal cost of production, and the inevitable effect of this plain fact on supply over the next 12-24 months, coupled with generational oversold statuses, near universal despair amongst investors (with many funds closing) and management of many companies retrenching from build outs, the “cure for low prices is low prices” adage will be tested in 2016.
From a contrarian, investor allocation, technical, sentiment and value perspective, we are hard pressed, with the exception of the 2008 global markets meltdown, to recall a more compelling investment case.
Crude Oil grabbed the headlines
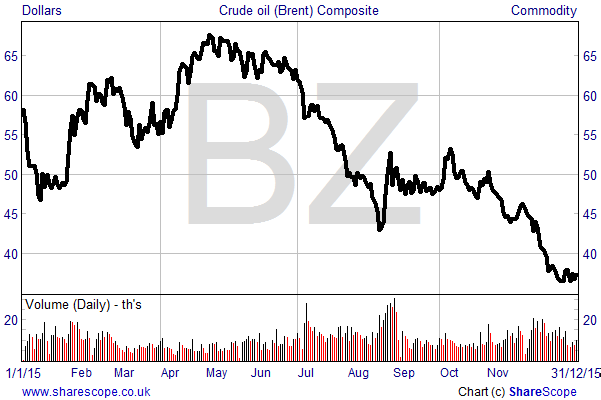
It was however the tanking oil price that made most of the headlines in 2015, with Brent crude ending the year down by 35% at $37.28. The ‘black gold’ has now lost two-thirds of its value over 18 months as production has risen (notably in the US largely as a result of the emergence of fracking) and as a weak global economy, in particular a material slowing in economic activity in China, has hit demand.
It was a similar story across the rest of the market, with falling demand, exacerbated by a rising US dollar, ensuring that the commodity sector bear market continued for the fifth consecutive year.
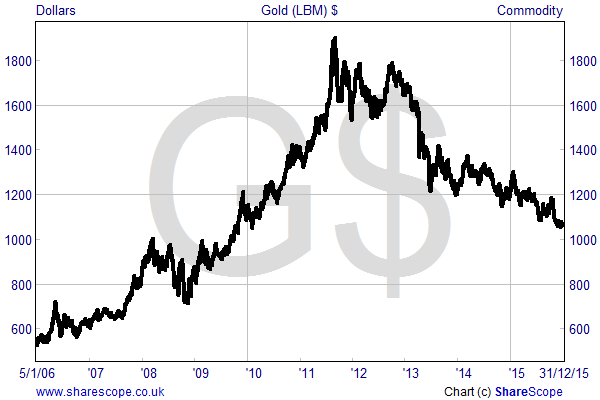
Amongst other individual commodities, during 2015 iron ore prices plunged by 41%, zinc fell by 27%, and both copper and aluminium were down by 26%. Amongst the precious metals platinum had a similar fate, falling by 28% over the year. While silver posted a third down year in a row it showed a more modest fall of 14%. One of the best relative performers, but still down by 10%, was gold, which now trades at a six year low of $1,060 an ounce, as the chart below illustrates.
All but one blue-chip mining stock declined in 2015
The continued mining sector collapse was the primary reason for the mining/oil & gas heavy FTSE 100 falling by 5% over 2015. Out of 10 such firms in the blue-chip index all but one showed a loss. The sole riser, BG Group, only performing as it did on the back of its takeover by Royal Dutch Shell.
The worst share price fall was produced by Anglo American – down by 75% to an all-time low. Elsewhere, mining industry bellwether BHP Billiton lost 45% of its value and the well-publicised debt issues at Glencore drove its shares down by 70% – vying with AAL during the 3rd quarter as the worst performer in the FTSE.
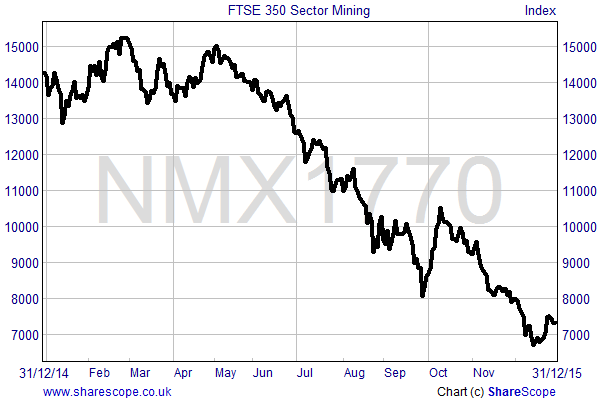
Overall, the FTSE 350 Mining Sector index lost 49% of its value in 2015 – comparable in fact to the Great Financial Crisis of 2007-08. The performance has led many industry commentators to suggest that this is the worst commodity bear market since the 1960’s.
A Golden Opportunity?
The gold price has been on a consistent downtrend for over four and a half years now. With expectations for further recovery in the global economy and continued interest rate increases by the Fed this year, the general market consensus for the yellow metal remains modestly bearish. However, at Align Research, we have a more bullish stance on gold for the following reasons:
1. Positive supply/demand imbalance
The speculative bubble which drove gold to $1,900 an ounce in 2011 has well and truly burst. Of that we can be in no doubt. Now back at $1,060 an ounce the market can now focus on the fundamentals of supply and demand, and it’s clear that the fundamentals are strong. Namely, supply is under pressure and demand for physical gold continues to rise.
On the supply side, the most recent quarterly report from the World Gold Council (http://www.gold.org/download/file/4457/GDT_Q3_2015.pdf) reported that the supply of gold from mine production fell by 1% in the third quarter of 2015. This comes after a long period of growth, but the market is now being affected by declining output from older mines and growth rates reaching their peak at newer operations. In addition, the current low price environment has reduced the incentive for scrap sales. In Q3 supply from recycled gold, which makes up around 25% of the market, fell by 6%. Overall, the World Gold Council’s report confirmed that supply conditions within the market remain relatively tight.
While the “all-in sustaining cost” for gold mining has fallen from $1,113 an ounce in Q1 2013 to $900 in Q2 this year, the gold price fall over the period was more pronounced, reducing profit margins from around $500 an ounce to less than $300. As a result we have seen mining companies cut back on capital expenditure, close unprofitable operations and fail to invest in new projects. This is clearly a negative factor for supply in the long to medium-term but a major positive for the price of the yellow metal.
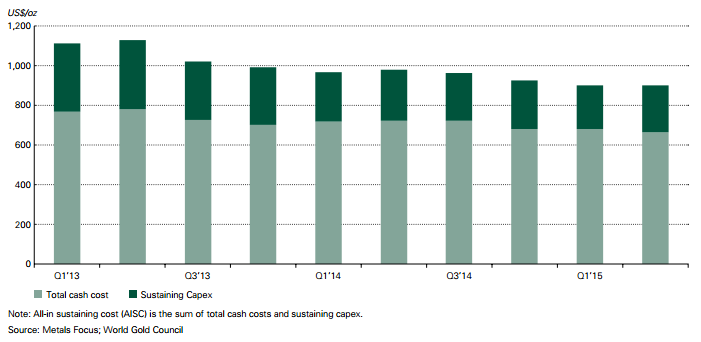
All in sustaining costs. Source: World Gold Council
On the demand side, purchases of physical gold have been growing recently, most notably in Asia and the Middle East, and central banks around the world have been net buyers.
In Q3 2015, the core jewellery sector (56% of the market) rose by 6%, with overall gold demand up by 8%. While central bank demand fell by 3% year-on-year to 175 tonnes, buying remains high, especially when compared to what was a record Q3 in the previous year. Purchases were driven by China, the country confirming in July that it has expanded its gold reserves by over 50% since 2009.
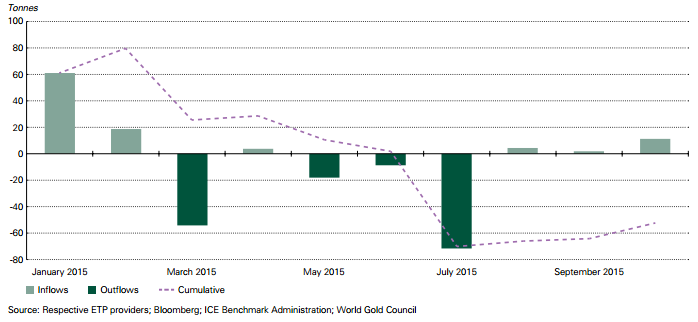
Notable in the period was a strong increase in investment demand for gold, with physical bars and coins surging by 33%. While there were further outflows from ETFs and other financial instruments it does appear that we are reaching a turning point here as the “smart money” now starts to realise the inherent value in the market and as the chart below illustrates. Between January and October this year ETF holdings are down by just 54 tonnes, compared to 780 tonnes and 133 tonnes over the same period of 2013 and 2014 respectively.
2. Gold as an attractive portfolio diversifier
While global equity markets in aggregate fell back modestly over 2015, many remain highly valued by historic standards. For example, the Shiller PE ratio (the valuation indicator which adjusts for 10 year earnings) puts the S&P 500 on a multiple of 25.9 times, well above the long-term average of 16.7 times.
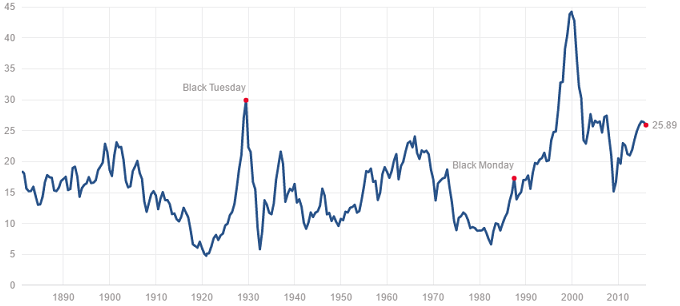
Source: http://www.multpl.com/shiller-pe/
The expectation for rising interest rates around the global economies will also put pressure on, what in some countries, are highly inflated property markets. As such, given the downside potential in both the equity and real estate markets, we believe that gold will become more attractive as a portfolio diversifier. As we opined at the beginning of this piece with the 30 year returns table, as equities potentially decline, the inverse correlation with commodities does, at times, come into its own. We believe 2016-17 is likely to be such a period as capital moves from one asset class to another.
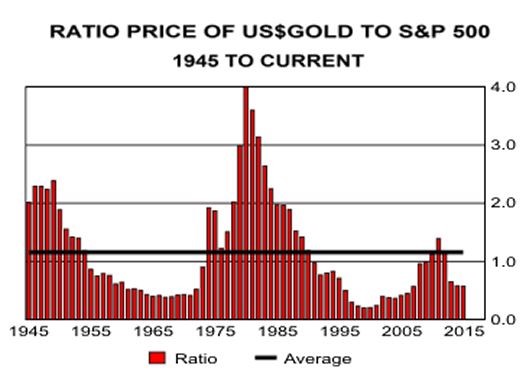
In terms of just how undervalued gold is relative to the S&P500, take a look at this chart which paints a thousand words. We are once more nearing multi-generational lows. In order to revert to the simple mean either gold has to double, the S&P 500 has to half, or perhaps a mixture of the two. Food for thought…
3. Slowdown in the meteoric rise of the US dollar
One of the main contributing factors to the fall in the gold price over the past few years is the strengthening US dollar. This is of course as one is the inverse of the other during “normal” economic times. It is notable that in euros and many other currencies that the price of gold rose during 2015.
The US Dollar Index, calculated against a weighted basket of six major currencies, has risen by 35% since bottoming out in April 2011 and rose by 8.3% in 2015 alone. The inverse relationship between the two assets has become more pronounced since the speculative gold bubble began to burst at the end of 2012 – see chart.
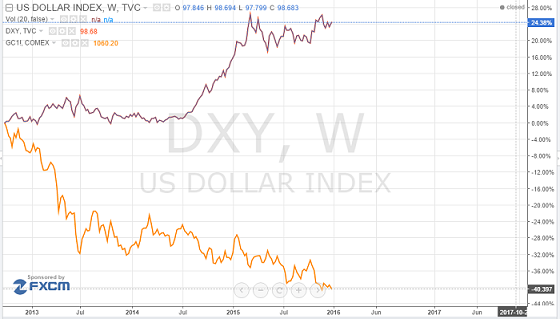
US Dollar Index vs Gold relative performance. Source: https://www.tradingview.com
December saw the Federal Reserve make it’s much anticipated and first interest rate rise in nine years, with the prospect of 3-4 further rises amounting to perhaps 100 basis points throughout 2016. Conventional wisdom is that this would be negative for gold if put into effect – especially given that the bond markets are currently only pricing in two rate rises this year.
But the Fed has developed a reputation for getting its economic growth forecasts wrong and for delaying its rate rise expectations – one year ago GDP growth for 2014 was expected at 2.6%-3%, when, in all likelihood, it will turn out to have been around 2.1%. With the US economy exposed to a multitude of global risk factors and CPI inflation remaining low at 0.5% we believe that a steady string of rate rises this year looks unlikely.
What’s more, even if the rises do occur, we note that historic records actually show that gold typically rises during such a period – another example of how the risk/reward skew is loaded in the investor’s favour in our opinion.
In addition, bond markets have seen long-term rates fall since the December Fed funds rate increase, wary of economic growth concerns. In particular, we note recent comments from analysts at JP Morgan, who said in a note that the risk of a US recession has increased materially over the next two-three years (http://uk.businessinsider.com/us-at-risk-of-recession-says-jpmorgan-2015-12). We would not be surprised to see the bandwagon of NIRP (negative interest rate policy) that has become prevalent in Europe actually touch the shores of the US should equities wane in 2016 and a recession takes hold. Gold actually outperforms during recessions and so we see a “heads we win, tails you lose” scenario in both macro instances.
Positioning for the upswing
Given the gearing effect of commodity prices on company profits we are now seeing some of the most depressed valuations in the mining sector in living memory, especially amongst the juniors. As you can see from an exploration of our site, we are actively pursuing research opportunities in the commodities space as we enter 2016. That, and putting our money where our collective mouths are.
We hope to bring our research capability to a wider audience’s attention with this new company and look forward to commencing writing on the multitude investment opportunities we presently see.
In the interim, for those inclined towards our assessment of the investment landscape as laid out here, one of the ways to gain exposure, in our opinion, to the precious metals sphere is via the ETF known as the market Vectors Junior Gold Miners (GDXJ code).
The composition of this ETF includes some good sized companies and not high risk minnows with “all or nothing” exploration projects. The top 5 holdings include Hecla Mining, Pan American Silver, Silver Standard Resources, First Majestic and Osisko. This provides a way to obtain wholesale exposure to the sector, with good liquidity (the holdings are circa $1.3bn in size) and minimise “management” risk.
Richard Jennings & Richard Gill, CFA