
Global markets look set for a renewed near term rally

By Richard Jennings, CFA
The last time we wrote about global markets was here whereupon our timing was fortuitous, with markets rallying by a good several percent thereafter.
There is an old stock market saying that, it has to be said like many other supposed stock market pointers, has a hit and miss record and that is “sell in May and go away”. It is my assertion that this year this will prove to be duff advice and that the major global markets – Major European (including UK), Japan and the US are likely to tack on another 5-7% in the next couple of months.
Here are my reasons as to why I believe the path of least resistance is likely to be up in the near term.
1. There are many sentiment measures that one can use, typically in a contrarian manner and not one is infallible. Rather a blend of the most useful ones is the best that I find to use as a guide to the future direction. The ones I use are the equity only put call ratio & the AAII sentiment measure. When these point towards the extreme of pessimism and the long term trend remains up but markets are relatively oversold then this has, for me, historically proved a good guide to future positive returns.
At present, as we can see in the chart below which is a weekly measure of the equity only put/call ratio, sentiment remains bearish. This tells me a lot of hedging has already taken place and that a good degree of outright selling has also too. Weekly closes over 0.8 have a very good track record of marking near term bottoms and we have been above this figure for 3 of the last 4 weeks which the most recent one printing a close of 0.78.
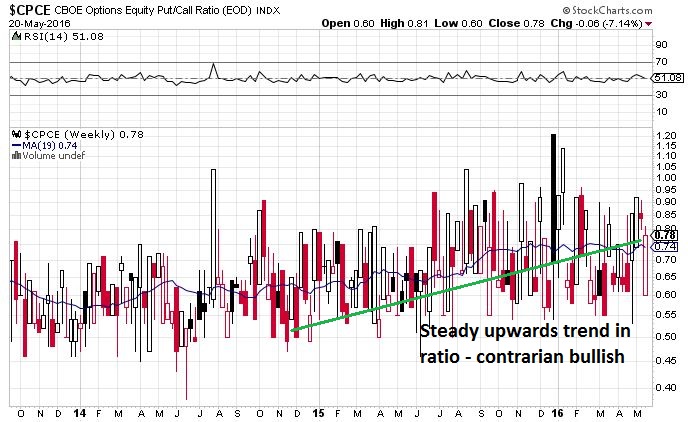
Chart: equity only put/call ratio
Turning to the most recent AAII sentiment survey measure. What stands out to me here is the continuation of low bulls and neutral sentiment. The ideal situation to look for is low bulls in unison with high bears but this is usually only prevalent at the end of deep bear markets. What is noticeable is that with the bull market now over 7 years in length, that we have still not reached a manic/euphoric phase in the wider market (accepted we have seen this in localised sectors such as tech for example).
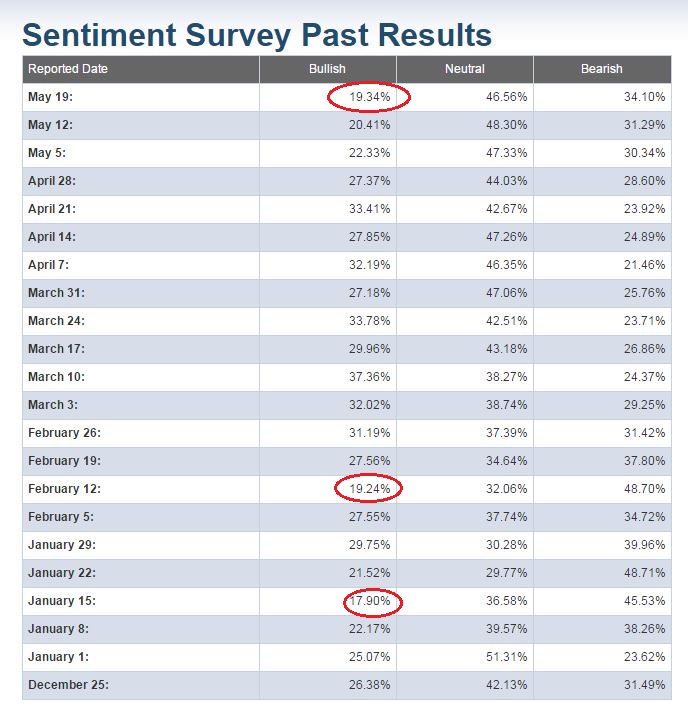
Table: AAII sentiment survey
These sentiment figures are not typical precursors of deep drawdowns. In fact, as I have circled, the last time we printed a sub 20% bull figure coincided exactly with the weekly low for 2016 and the S&P went on a tear that took it up 15% in a little over 2 months. The prior print of just 17% in mid-January also coincided with a short term bottom in the S&P 500 (albeit subsequently retested). I am also encouraged as a contrarian by the sharp increase in bear sentiment in the last 5 weeks from a low of 21.46% to the recent figure of 34.1%.
2. In looking at the S&P500 chart below, the primary long term moving average I use is the 37 week exponential one. The fact that the market has not broken below this, let alone on a consecutive weekly basis whilst sentiment has taken a turn for the worse is a very encouraging sign. With the RSI back in the neutral 53 zone there is plenty of potential fuel to the upside too and the MACD line has also remained above the zero line. In short, I do not see a breakdown and portent of imminent doom in this picture.
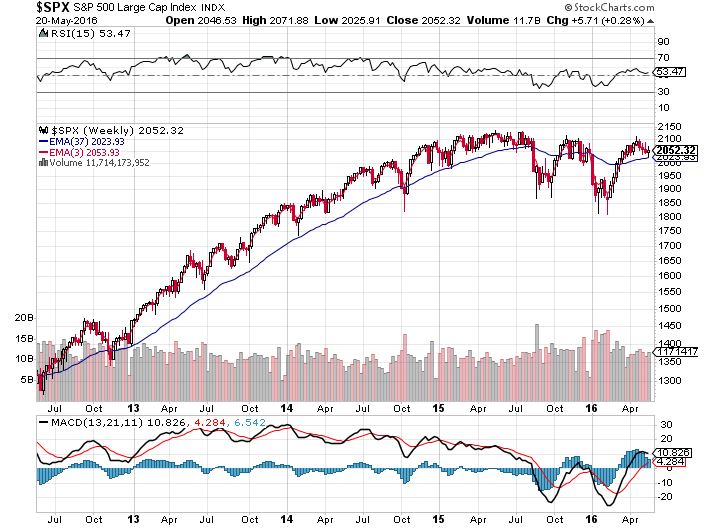
Chart: S&P 500
3. In looking at the CoT sentiment charts, taking the Nasdaq and the S&P500 as the two leaders, the so called “managed money” positioning is also not pointing towards a down leg. Generally when this is loaded in the extreme one way or another, a top or bottom of sorts is typically seen within weeks of this positioning as the charts below pay testimony to.
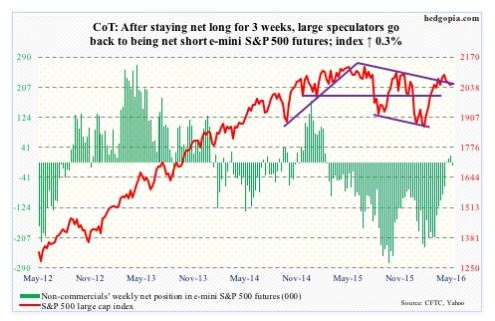
Chart: S&P500 CoT
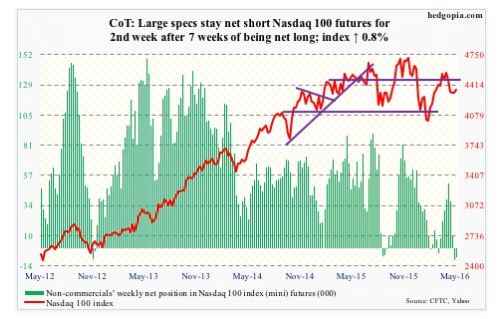
Chart: Nasdaq CoT
Finally, there are a number of sectors and markets in particular that offer good value – global banks for example trade near historic lows on book value measures (ex the 2008/09 crisis of course) – our favoured picks for deep value here being Barclays Bank and Credit Suisse, a number of Oil E&P’s still look cheap relative to NAV – Tullow and Ophir being 2 stand outs. At an aggregate index level – the DAX is the cheapest of the major European markets and the Japanese market is again looking in the early 16,000’s like a decent pick on a 12-18 month view.
As ever, this is not to be taken as specific advice, more of a general pointer in relation to our current macro thinking.
CLEAR DISCLOSURE – The author of this piece holds long positions in the DAX, Ophir Energy and Credit Suisse. He may implement new positions in any of the markets mentioned here in the days and weeks ahead.