
Selected equity markets now offer compelling value
By Richard Jennings, CFA

For investors in global equities the onset of 2016 has most certainly not brought any New Year optimism. Indeed, the incessant Atlantic depressions that have brought misery, wind and rain to many seem rather apt given that many observers point the finger squarely at the embattled Fed for the lacklustre stock market performance on our side of the ocean.
Recent weeks in particular have been brutal for many markets and sectors, with the global banking index taking a drubbing and the German, Hong Kong and Japanese markets falling between 8% and 16% (at the lows). Calls that we are in a fully-fledged global bear market now abound.
Certain European banking stocks such as Credit Suisse and Deutsche Bank have fallen by up to a quarter as the move to NIRP (negative interest rates) has caused investors to doubt the ability of banks to maintain their interest rate spreads. Indeed, the NIRP policy that was supposed to encourage banks to lend – as opposed to keeping monies on their balance sheets – may prove to achieve precisely the opposite!

Amongst all this doom and gloom however I believe that selected equity markets now offer the best entry point since the summer swoon of 2011. In some cases I am expecting 10-15% rallies over the next quarter.
A number of technical and fundamental pointers lead me to this conclusion:
1. Considering the battering the equity markets took last week, Friday’s close in the US was in fact the best day (1.95%) that has followed a 5-day SPX losing streak since March 2009. That could be a sign of selling exhaustion and potentially a very good omen given the additional points relayed below.
2. One of my favoured markets on a risk/reward basis is actually our domestic market, the FTSE 100. At its lows on Thursday (a smidgen under 5,500) the index was yielding just over 4.4%. Set against base rates of 0.5% and 10 year gilt yields of 1.88% (at the time of writing) then it is clear to seasoned investors that money being earmarked for the medium term by asset allocators will be going into equities, particularly as over time one expects underlying dividends to grow.
There is one potential arbitrage that the more risk orientated investor could consider – purchasing the FTSE 100 future via a spreadbet or CFD. Given that the pricing of these is typically 2.5% above LIBOR (so circa 3% debit to your account on an annual basis) and with the dividend receipt usually 90% of the gross (@ 4% net at present credit) – then “punters” could actually buy the index for a modest credit receipt, i.e. in effect you are being paid to take a position in the index. (Disclaimer – this point is for observational and reiterative purposes regarding the value we see and not a recommendation to spreadbet indices).
Another little mentioned fact is that at current levels the FTSE 100 is now back to where it was at the beginning of 1998 (see chart below). That is near 20 years of zero capital returns for tracker buyers!
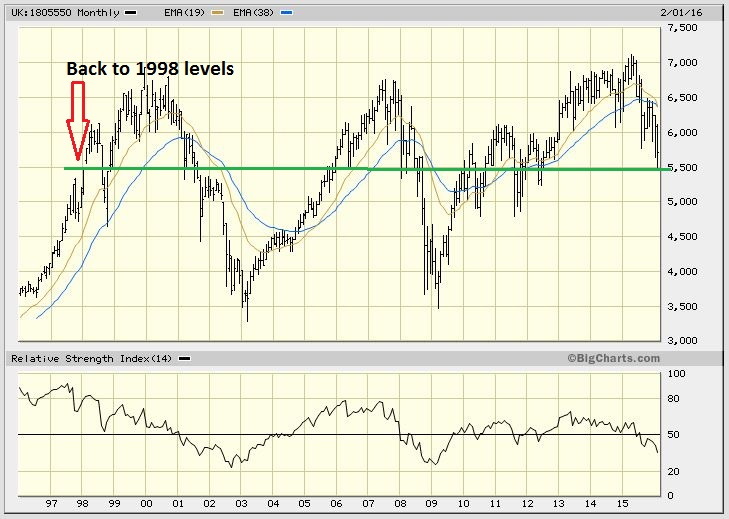
Of course, investors would have collected dividends over this period and still outperformed cash. But considering that dividends have risen over this period and that base rates back in 1998 were just over 7% that is one helluva switch in respective asset class fortunes.
Of course a number of companies within the FTSE have flagged dividend cuts, almost all within the commodities sphere. But still, the income offer is materially more attractive relative to gilts and even compared to commercial and residential property (without the hassle of the latter too).
3. Sentiment, as alluded to above, is well and truly on the floor. There are various indicators that people refer to but the ones I find most useful are a combination of the following three:
– AAII sentiment survey.
– the CoT position of Managed Money (i.e. the other side of the Commercials – aka specialists and market makers).
– the Put:Call ratio (both equity only and aggregate – index and equity).
Let’s take a look at each of these in turn:
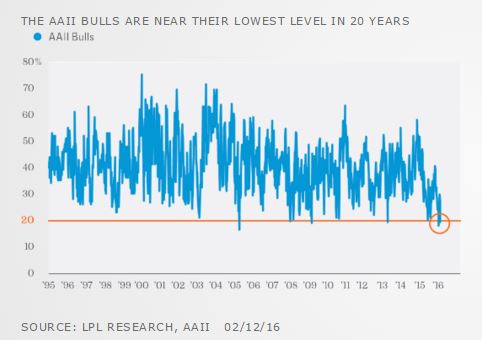
LPL Research actually did the hard work here (www.lplresearch.com) with the fantastic analyst Ryan Detrick coming up trumps again. The takeaway point for me is that on the prior occasions we have probed these types of negative readings (2005, 2008-09 and 2013), with the exception of the GFC (Great Financial Crisis), the market has not been meaningfully lower over the ensuing weeks. And on 12-24 month timescales the market has been higher.
Throw into the mix the fact that equity outflows continued in the US last week for the 6th consecutive week, and it is beginning to smell to me like the sellers are becoming exhausted, i.e. those that want out are out. This is only the 6th time in the last 20 years this degree of negativity has occurred. Indeed, the AAII bull sentiment print (red line on above chart) is less than 20%, only the 6th time in the last 20 years this degree of negativity has occurred.
As mentioned already, excluding the GFC this has been a resolutely bullish contrarian signal. Again according to LPL, one month later the S&P 500 has been up by an average of 4.9% (median of 0.9%), and three months later by an average of 10.7% (median of 5.3%).
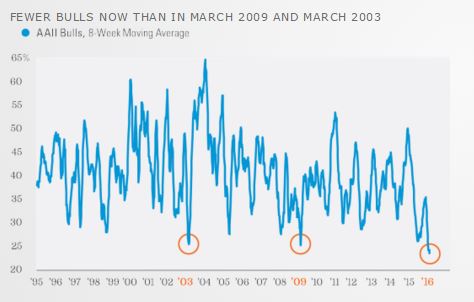
The really interesting element is, per the chart below, that using a “smoothed” measure of the AAII sentiment figures – the 8 week moving average – we are in fact below the measures seen at the trough of the 2003 and 2009 bear markets. That really is a fascinating observation.
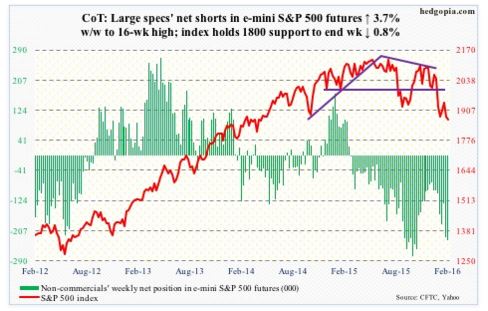
With regards to the CoT (Commitment of Traders positioning), as we can see from the chart below, with 234,000 contracts short (non-commercial), we are probing levels seen over the last 3 years that have been coincident with reversals of trends in the S&P 500.
I couple the above observation with two other technical facts seen last week. Firstly, the “line in the sand” at 1,812 seen in the closing days of August last year (on the futures), and also in early January, was successfully defended. Secondly, the VIX hit a high just over 30 and reversed intraday on Thursday. The chart structure is beginning to look ever more constructive on the bull side.
Finally, one of my real favourite indicators is the Put:Call ratio. If I was to use only one sentiment indicator it would be this. The measure is a contrarian indicator and extreme prints, particularly on the bearish side (bullish as a contrarian) are very useful, particularly when coupled with other sentiment indicators.
Let’s take a look at the equity only Put:Call measure first.
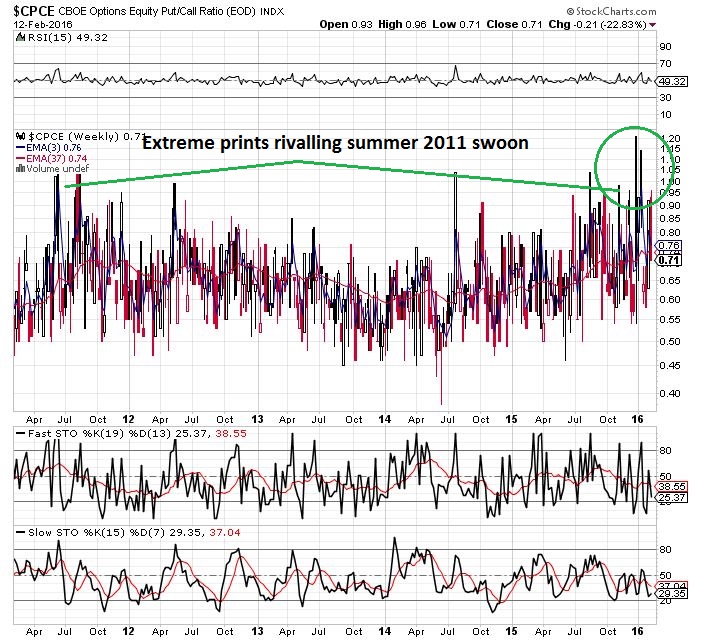
We can see clearly in this weekly chart that in recent months the level of bearishness has continued to edge steadily higher, printing extreme measures. With successive prints over 1 on a weekly closing basis this tells me, again, that the sellers that want out are out or, equally usefully, that many institutions are hedged for a fall. It is when nobody expects a fall that the market generally delivers an elevator to take them down.
From my own dataset, the confluence of Put:Call measures over 2 standard deviations from the norm during the last 6 weeks has had a very high, statistically significant, correlation with market rises over 1,3 & 12 month timescales. With hard facts such as the DAX being down 10 out of 12 days early doors on Friday and the Nikkei down near 15% in just 3 trading days, the buy case to me becomes ever more entrenched.
CONCLUSION
There are NEVER any guarantees in the markets but the glaring standout to me is that, based on tried and tested historical measures and observations, and a degree of “gut feel” thrown in, to lean into the short side now could be tantamount to picking pennies up in front of a freight train. When the boat leans one way, it usually pays to move to the other side. I am looking for weakness in the FTSE, Nikkei, DAX, China, selected banks and of course, the basket of commodity plays from here on out.
To receive our insightful blogs as soon as they are released sign up below.